AI anomaly detection is the use of artificial intelligence to automatically identify data privacy, events, or observations that deviate significantly from expected behavior within a dataset. For data analysts and scientists, this capability transforms how organizations surface hidden risks, catch errors early, and uncover unusual patterns in data that would otherwise go unnoticed.
Traditional rule-based approaches required analysts to define every threshold manually, a tedious process that couldn't scale to modern data volumes. AI anomaly detection changes this by learning what "normal" looks like from the data itself and flagging anything that falls outside those learned boundaries. The stakes are real: undetected anomalies in financial transactions can mean millions lost to fraud, while missed sensor readings in manufacturing can lead to catastrophic equipment failure.
Whether you work with structured tabular data or streaming time series, understanding how AI-powered outlier detection works is foundational to building reliable data pipelines.
Key Takeaways
- AI anomaly detection learns normal data patterns and flags deviations without manual threshold setting.
- Unsupervised methods like Isolation Forest work well when labeled anomaly data is unavailable.
- Supervised approaches achieve higher precision but require curated training datasets with known anomalies.
- False positives remain the biggest practical challenge in production anomaly detection systems.
- Combining multiple detection methods consistently outperforms any single algorithm used alone.
How AI Anomaly Detection Works
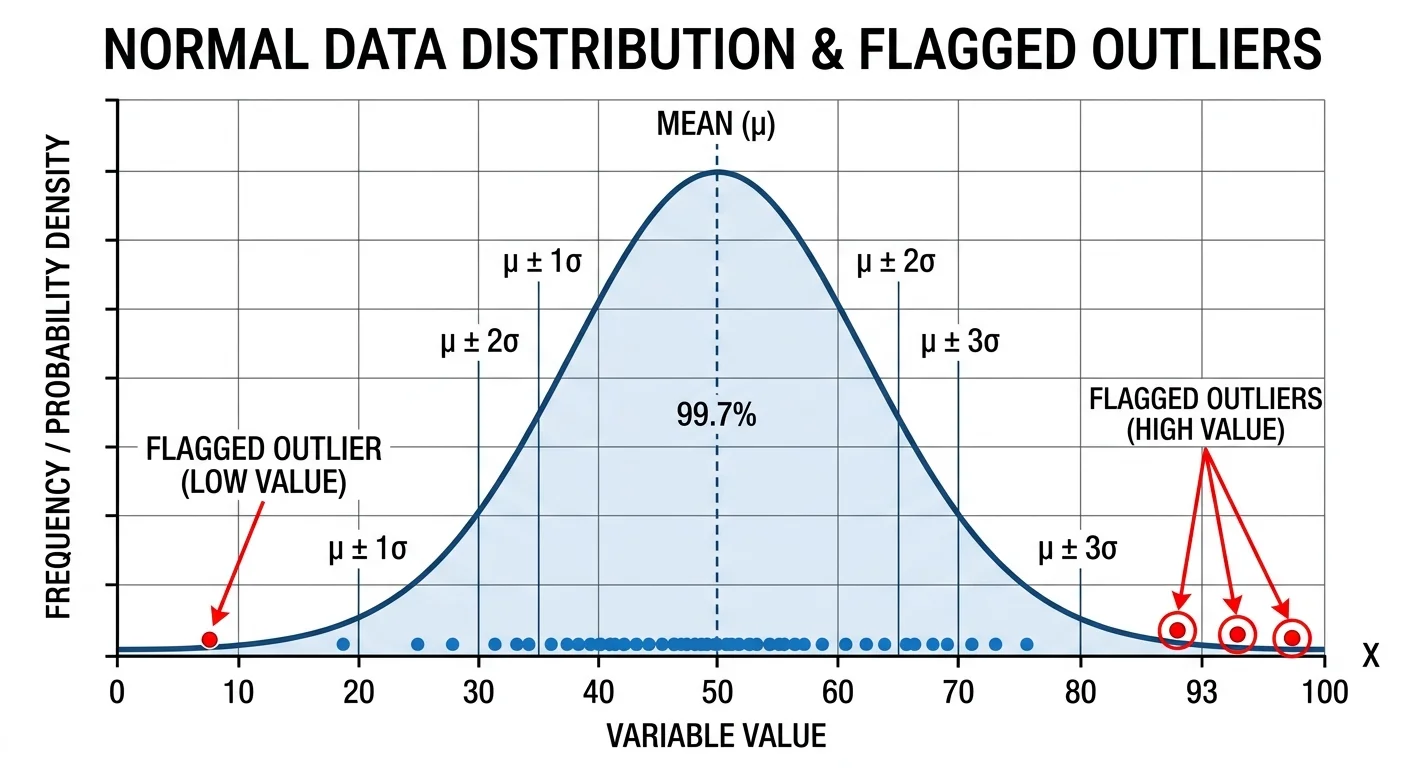
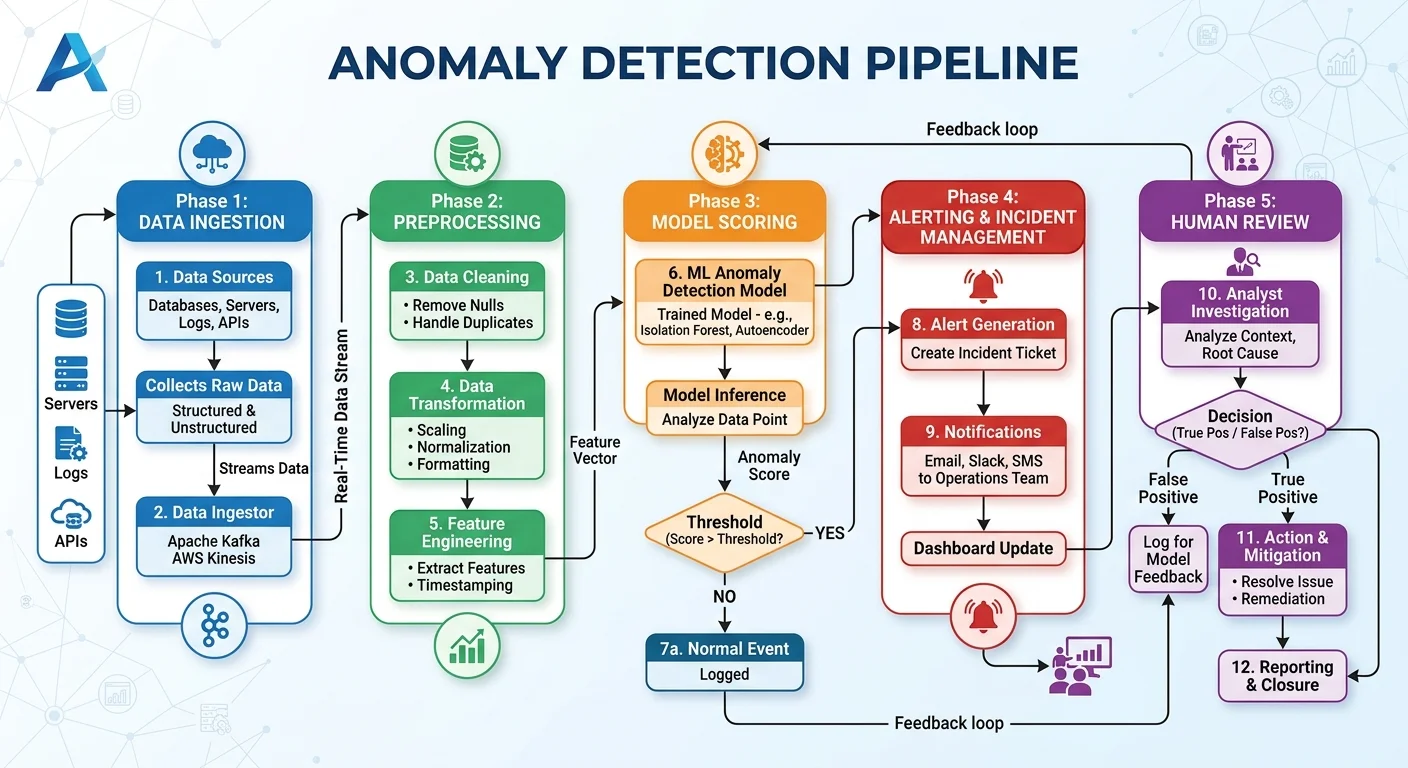
At its core, AI anomaly detection builds a statistical or mathematical model of what normal data looks like. The model ingests historical data, identifies the structure, distribution, and relationships within it, then scores new observations based on how much they deviate from that learned baseline. Points that exceed a deviation threshold are flagged as anomalies. This process can run in batch mode on stored datasets or in real time against streaming data, depending on the use case and infrastructure.
Supervised vs. Unsupervised Approaches
Supervised methods require a labeled dataset where anomalies are already tagged. The model learns the specific characteristics of known anomalies and predicts them in new data. This approach yields high accuracy when quality labels exist, but obtaining those labels is expensive and time-consuming. In many real-world scenarios, anomalies represent less than 1% of all observations, making the labeling task particularly difficult for data teams with limited resources.
Unsupervised methods, by contrast, assume no labels exist. They detect data anomalies by finding observations that sit far from the majority of data points in feature space. These methods are more flexible and widely applicable, which is why most production systems start with unsupervised detection. The tradeoff is a higher false positive rate, since the model lacks explicit guidance about which deviations actually matter to the business.
Common Algorithms in Practice
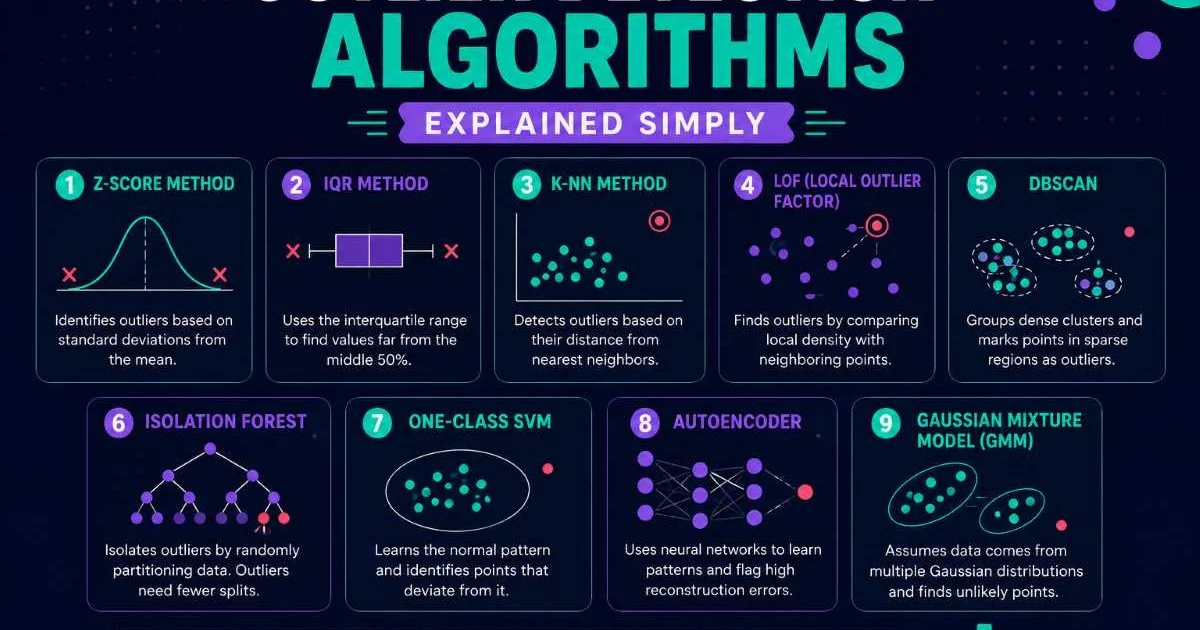
Several algorithms have become standard tools for AI data analysis focused on anomaly detection. Isolation Forest works by randomly partitioning data; anomalies require fewer partitions to isolate, giving them higher anomaly scores. Autoencoders, a type of neural network, learn to compress and reconstruct normal data, then flag points that reconstruct poorly. Local Outlier Factor (LOF) compares the density of a point's neighborhood to surrounding neighborhoods, catching anomalies that cluster-based methods might miss. Each algorithm has distinct strengths depending on data dimensionality and distribution.
Start with Isolation Forest for tabular data. It requires minimal hyperparameter tuning and handles high-dimensional datasets effectively.
Why It Matters: Use Cases Across Industries
Error detection in datasets is not an abstract academic exercise. It drives measurable business outcomes across every sector that relies on data quality. When a retailer's pricing feed contains erroneous values, customers see absurd prices and trust erodes. When a hospital's patient monitoring system misses a vital sign anomaly, the consequences can be life-threatening. AI anomaly detection provides the automated vigilance that human reviewers simply cannot sustain across millions of data points per day.
Finance and Fraud Detection
Financial institutions were among the earliest adopters of AI-based outlier detection. Credit card companies process billions of transactions daily, and even a small percentage of fraudulent ones represents massive losses. Models trained on transaction features like amount, location, merchant category, and timing can flag suspicious activity within milliseconds. JPMorgan Chase reported that its AI fraud detection systems now review transactions that would require over 360,000 hours of human lawyer time annually. The speed and scale advantages are impossible to replicate with manual review.
Manufacturing and IoT
Predictive maintenance in manufacturing depends heavily on detecting unusual patterns in data from sensors, vibration monitors, and temperature gauges. A subtle shift in a motor's vibration frequency might indicate bearing wear weeks before failure occurs. Similarly, smart security cameras with AI detection capabilities use anomaly detection to distinguish genuine security threats from routine movement. These IoT applications demonstrate how anomaly detection has expanded well beyond traditional data science workflows into embedded real-time systems.
The healthcare sector also benefits enormously. Clinical labs use anomaly detection to catch instrument calibration drift, ensuring test results remain accurate. Insurance companies flag unusual claims patterns that suggest fraud rings. Even agricultural operations use satellite imagery anomaly detection to identify crop disease outbreaks before they spread across entire fields.
Common Misconceptions About Outlier Detection
The most persistent misconception is that all outliers are errors. This is flatly wrong. An outlier might represent a genuine rare event, like an unusually large but legitimate purchase, or a data entry mistake that needs correction. The distinction matters enormously because your response should differ: genuine rare events often contain the most valuable business insights, while errors need to be fixed or removed. AI anomaly detection flags both, but human judgment remains necessary to classify the result.
"Not every outlier is an error, and not every error is an outlier. Treating them identically is one of the fastest ways to undermine your data quality program."
Another common mistake is assuming that a single algorithm is sufficient. No single method excels across all data types and anomaly patterns. Point anomalies (individual unusual values) differ fundamentally from contextual anomalies (values that are only unusual in a specific context) and collective anomalies (groups of data points that are anomalous together). Practitioners who rely on one technique inevitably miss entire categories of unusual behavior. Ensemble approaches that combine multiple algorithms consistently produce more robust detection.
Contextual anomalies are especially tricky. A temperature reading of 95°F is normal in July but anomalous in January. Your model needs temporal context to catch these.
There is also a widespread belief that more data always improves detection accuracy. While larger datasets generally help models learn better representations of normal behavior, they can also dilute rare anomaly signals if the data contains concept drift. Data distributions change over time, and models trained on historical patterns may flag perfectly normal new behavior as anomalous. Regular model retraining and monitoring are essential to maintaining detection quality over time. Without this maintenance, false positive rates climb steadily until analysts start ignoring alerts altogether.
Finally, some teams assume that setting up an anomaly detection pipeline is a one-time project. In practice, it requires ongoing calibration. Business rules change, data sources evolve, and the definition of "abnormal" shifts with market conditions. Treating anomaly detection as a living system rather than a static deployment separates teams that get lasting value from those that abandon the effort within months.
Alert fatigue from excessive false positives is the number one reason anomaly detection projects fail in production. Tune your thresholds aggressively.
Related Concepts and How They Connect
AI anomaly detection sits at the intersection of several related disciplines. Understanding where it fits helps analysts choose the right tool for their specific problem. Change point detection, for instance, identifies moments when the statistical properties of a time series shift permanently, not individual outliers but structural breaks. Novelty detection specifically targets observations that differ from the training data but are not necessarily errors. These sibling concepts share algorithms with anomaly detection but frame the problem differently.
Data quality monitoring is another closely related practice that increasingly incorporates AI anomaly detection as a core component. Tools in this space track schema changes, null rate spikes, distribution shifts, and volume anomalies across data pipelines. The Outlier Checker blog covers many of these practical data quality topics. While traditional data quality rules catch known issues (like a negative age value), AI-powered methods catch the unknown unknowns that no one thought to write a rule for.
Clustering algorithms like DBSCAN also relate to anomaly detection because points that don't belong to any cluster are natural outlier candidates. Dimensionality reduction techniques such as PCA and t-SNE help visualize high-dimensional anomalies in two or three dimensions, making it easier for analysts to interpret model output. These techniques are complementary rather than competing; skilled practitioners assemble them into pipelines tailored to their data's characteristics.
The relationship between AI anomaly detection and explainability deserves attention too. Flagging an anomaly is only half the job; analysts need to understand why a point was flagged to take appropriate action. Techniques like SHAP values and feature importance scores help translate black-box model outputs into actionable explanations. Without this interpretability layer, detection systems become "trust me" black boxes that analysts reasonably hesitate to rely on for high-stakes decisions.
Frequently Asked Questions
?How do I start with Isolation Forest when I have no labeled anomalies?
?When should I choose supervised over unsupervised anomaly detection?
?How long does it take to build a production-ready anomaly detection pipeline?
?Why are false positives such a big problem if AI learns normal patterns automatically?
Final Thoughts
AI anomaly detection is not a single algorithm or product but rather a discipline that combines statistical foundations, machine learning techniques, and domain expertise. For data analysts and scientists, it represents one of the most immediately practical applications of AI: finding the needles in ever-growing haystacks of data.
Start with well-understood unsupervised methods, validate results with domain experts, and iterate on thresholds until false positive rates are manageable. The organizations that invest in robust, maintained anomaly detection pipelines consistently make better decisions because they see problems before those problems become catastrophes.
Disclaimer: Portions of this content may have been generated using AI tools to enhance clarity and brevity. While reviewed by a human, independent verification is encouraged.