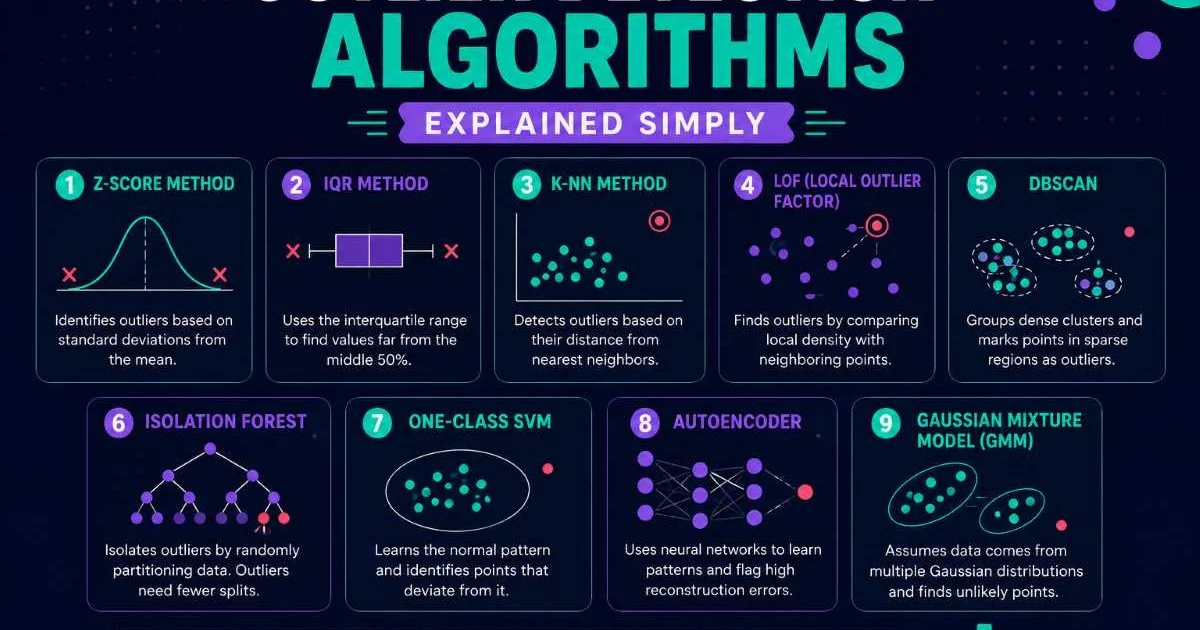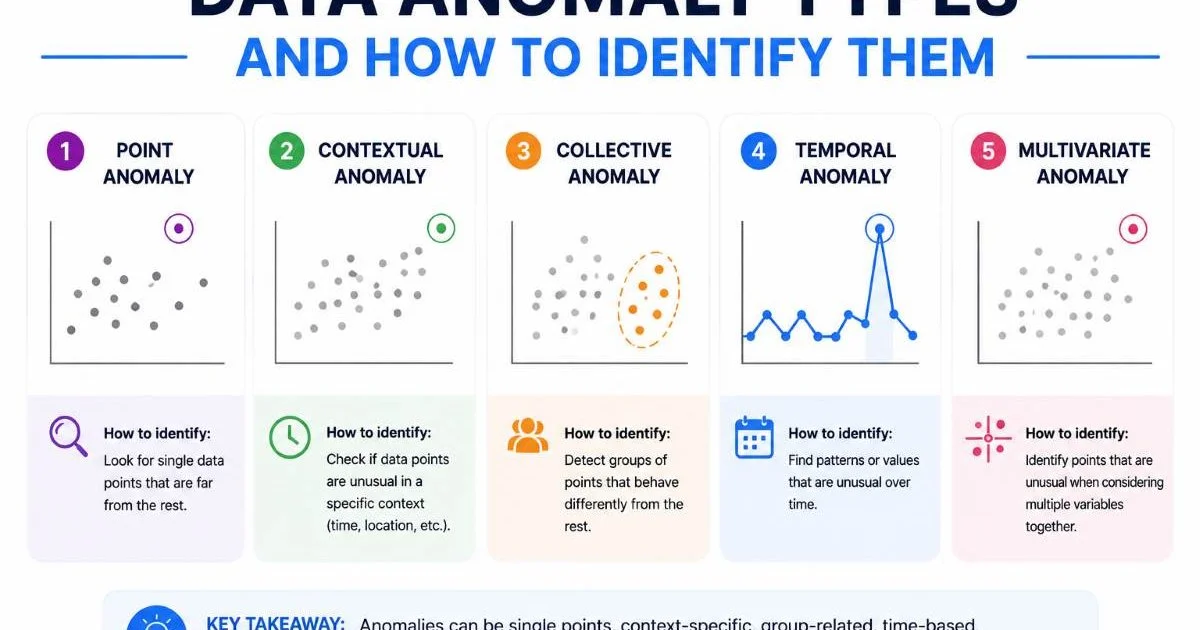
Data anomaly detection powered by AI has become a fundamental skill for analysts and scientists working with large, complex datasets. Whether you're hunting for fraud signals in financial transactions, spotting sensor malfunctions in IoT streams, or cleaning messy survey data, understanding the specific types of anomalies you might encounter is the first step toward catching them.
AI anomaly detection tools can automate much of this work, but knowing what you're looking for makes you far more effective at configuring, tuning, and interpreting the results. This guide breaks down the major categories of data anomalies, walks through practical identification techniques, and gives you a framework for choosing the right detection approach.
If you're new to the broader concept, our overview of what AI anomaly detection is, with definitions and examples, provides useful foundational context. By the end, you'll have a clear, actionable process for spotting and classifying the anomalies hiding in your data.
Key Takeaways
- Data anomalies fall into three primary categories: point, contextual, and collective anomalies.
- AI-based outlier detection algorithms significantly outperform manual inspection on large datasets.
- Contextual anomalies require domain knowledge because the same value can be normal or abnormal.
- Collective anomalies only appear when you analyze groups of data points together.
- Choosing the right detection method depends on your data type, volume, and anomaly category.
Step 1: Understand the Three Core Anomaly Types
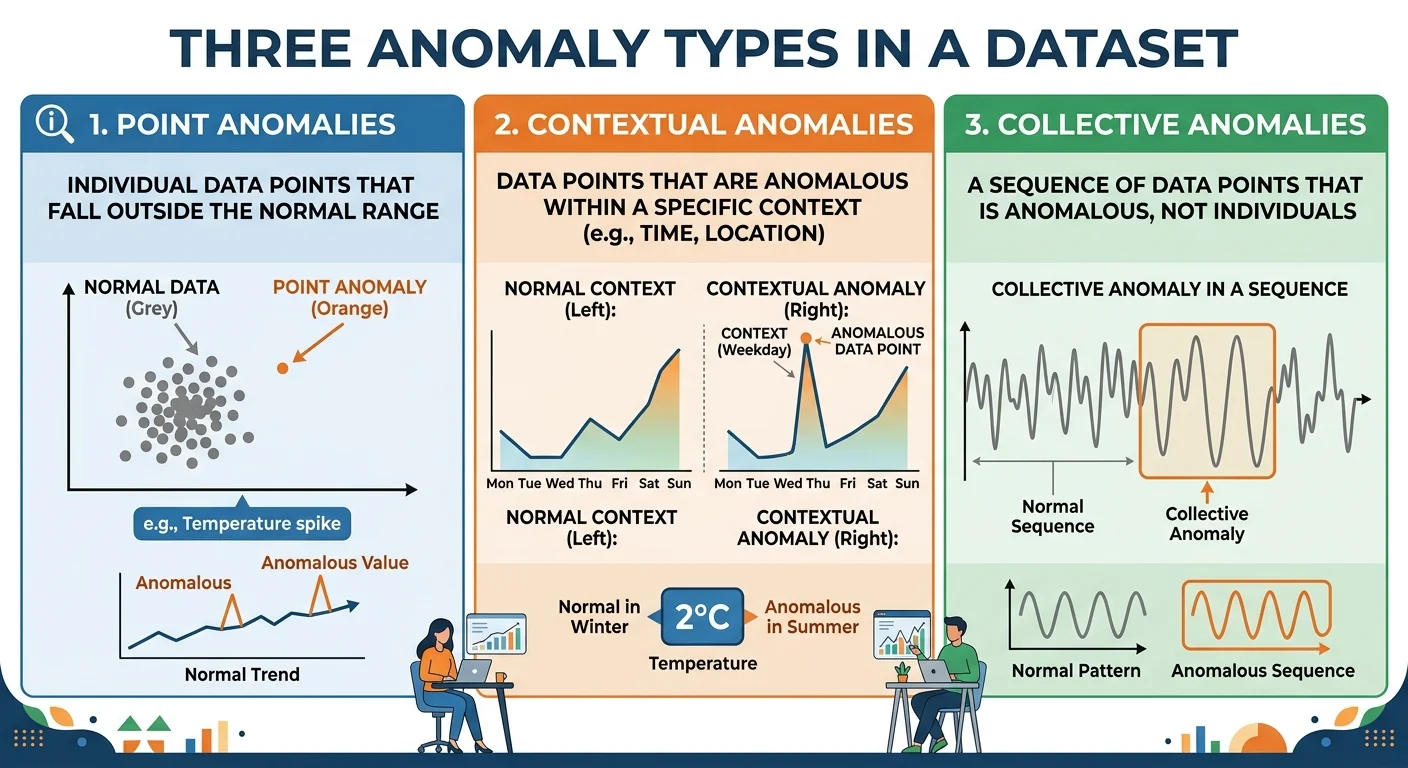
Before running any algorithm, you need a mental model for the kinds of anomalies that exist. Researchers and practitioners generally classify data anomalies into three categories: point anomalies, contextual anomalies, and collective anomalies. Each type requires a different mindset and, often, a different detection technique. Getting this taxonomy right will save you hours of chasing false positives or missing real problems.
Point Anomalies
A point anomaly is a single data point that deviates significantly from the rest of the dataset. Think of a credit card transaction for $15,000 when a customer's typical spend is $50 to $200. These are the most intuitive and common type. Standard statistical methods like Z-scores or IQR (interquartile range) catch many of them, and they're the bread and butter of AI fraud detection methods and use cases.
Start with Z-score analysis on numerical columns. Any point beyond 3 standard deviations warrants investigation.
Contextual Anomalies
Contextual anomalies (sometimes called conditional anomalies) are values that appear normal in isolation but become suspicious given their context. A temperature of 35°C is perfectly normal in July but extremely unusual in January for a city like Chicago. Detecting these requires incorporating contextual attributes such as time, location, or user history alongside the behavioral attributes you're measuring. This is where domain expertise becomes indispensable.
Collective Anomalies
Collective anomalies occur when a group of data points is anomalous together, even though each individual point might seem unremarkable. A sequence of small, rapid-fire login attempts from different IP addresses targeting the same account looks like a brute-force attack, but each individual login attempt is mundane. Identifying these patterns is central to AI anomaly detection in cybersecurity, where attackers deliberately keep individual actions below detection thresholds.
Step 2: Profile Your Data Before Detection
Running an outlier detection algorithm on data you don't understand is like searching for a needle in a haystack while blindfolded. Data profiling gives you baseline knowledge about distributions, missing values, and feature relationships. Without this step, you'll either drown in false alarms or miss anomalies that fall just outside your poorly calibrated thresholds. Spend time here; it pays dividends throughout the entire detection pipeline.
Statistical Profiling
Start by computing summary statistics for every feature: mean, median, standard deviation, skewness, and kurtosis. Pay close attention to the shape of distributions. Heavily skewed data (common in transaction amounts and network traffic) makes simple threshold methods unreliable. For these cases, consider log-transforming values or using percentile-based methods. Also check for missing data patterns, since gaps in time series can themselves be anomalous signals.
Also Check: HTML5 Semantic Tags List With Code Examples
Missing data isn't always random. Systematic gaps (e.g., sensors failing during extreme conditions) often coincide with the very events you want to detect.
Visual Exploration
Visualization remains one of the most powerful profiling tools available. Box plots reveal point outliers immediately. Scatter plot matrices help you spot multivariate anomalies where two features together create unusual combinations. Time series plots expose both contextual and collective anomalies through trend breaks and unusual periodicity changes. Don't skip this step even when working at scale; sample your data and visualize before automating.
For structured datasets, profiling should also include cardinality checks on categorical features and correlation analysis between numerical ones. Unexpected correlations (or the sudden absence of expected ones) often point toward data quality issues or genuine anomalies worth investigating. Document your profiling findings. They become the baseline against which you'll validate detection results later.
| Metric | What It Measures | Anomaly Signal |
|---|---|---|
| Z-score | Distance from mean in SDs | Point outliers beyond ±3 |
| IQR | Spread of middle 50% | Values beyond 1.5× IQR fences |
| Skewness | Distribution asymmetry | Heavy tails hiding outliers |
| Missing rate | Percentage of nulls | Systematic gaps or sensor failures |
| Cardinality | Unique value count | Unexpected new categories |
| Correlation | Feature relationships | Broken or new correlations |
Step 3: Select the Right AI Anomaly Detection Method
Once you understand your data and the types of anomalies you're hunting, you can select an appropriate detection method. No single algorithm handles all anomaly types equally well. The choice depends on whether you have labeled examples of anomalies, the dimensionality of your data, and whether you need real-time or batch processing. For a deeper technical breakdown, the guide to outlier detection algorithms explained simply covers the major options.
Supervised vs. Unsupervised Approaches
Supervised methods train on labeled datasets where anomalies are already tagged. They work well when you have sufficient examples of both normal and abnormal behavior, which is the case in mature fraud detection systems with years of chargeback data. Random forests, gradient boosting, and neural networks excel here. The downside is that they can only find anomaly patterns they've been trained on, making them blind to novel attack vectors or entirely new failure modes.
Unsupervised methods, by contrast, require no labels. They learn what "normal" looks like and flag anything that deviates. Isolation Forest, DBSCAN, and autoencoders are popular choices. These methods are better at catching unknown unknowns but tend to produce more false positives. In practice, many teams use a hybrid approach: unsupervised methods for exploration and discovery, then supervised models tuned on confirmed anomalies for production deployment.
"The best anomaly detection systems combine unsupervised discovery with supervised precision, creating a feedback loop that improves over time."
Algorithm Selection by Anomaly Type
For point anomalies in tabular data, Isolation Forest and Local Outlier Factor (LOF) are strong starting points. They handle high-dimensional data well and require minimal tuning. For contextual anomalies in time series, LSTM autoencoders and seasonal decomposition methods (like STL) capture temporal patterns that simpler methods miss. Collective anomalies typically require sequence-aware models such as Hidden Markov Models or graph-based approaches that can reason about relationships between data points.
Consider your operational constraints as well. Real-time detection in streaming data requires lightweight algorithms or pre-trained models with low inference latency. Batch analysis on data warehouses can afford computationally expensive methods like deep autoencoders. Also evaluate the database security best practices around your data pipeline, since anomaly detection is only as trustworthy as the data flowing into it.
Never deploy an anomaly detection model without testing it on a holdout set that includes known anomalies. Accuracy on normal data alone tells you nothing useful.
Step 4: Validate, Classify, and Act on Detected Anomalies
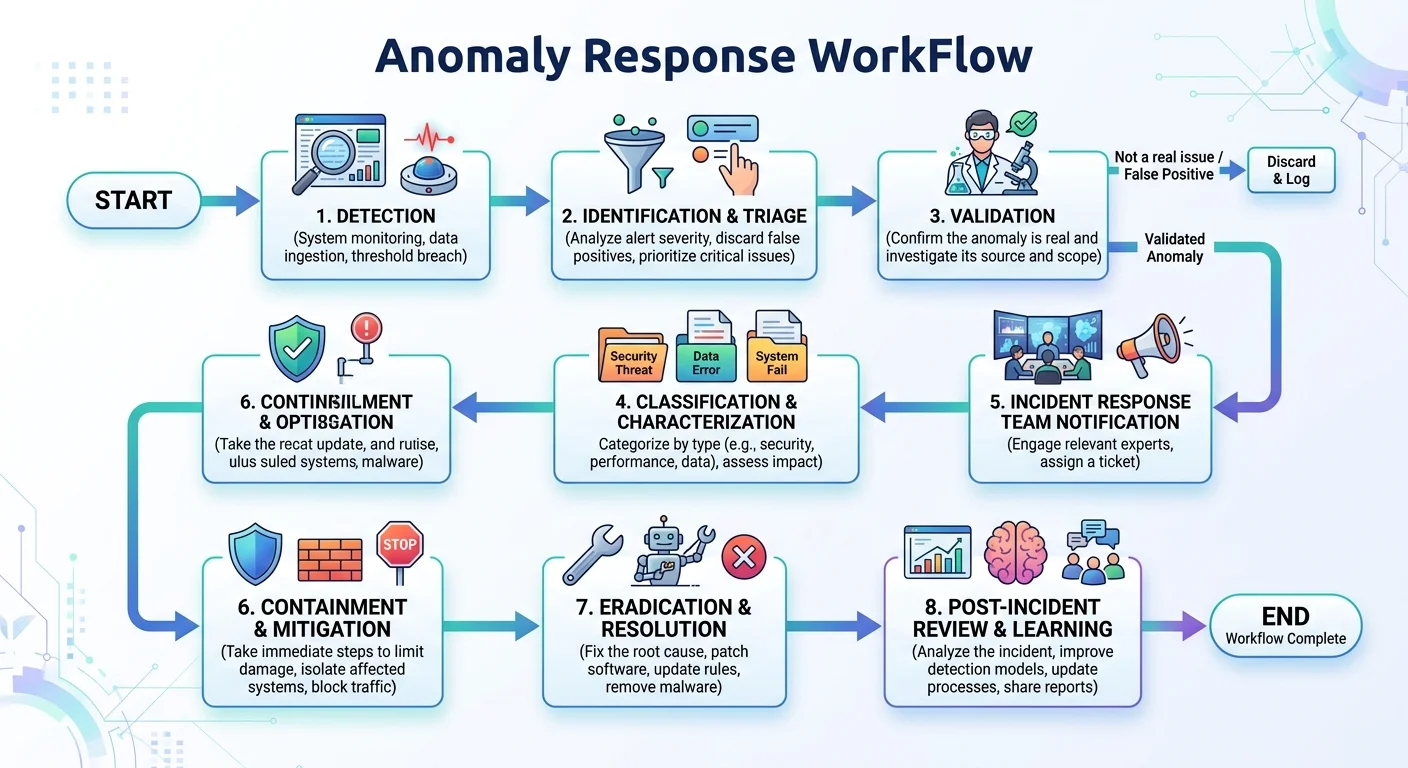
Detection is only half the battle. Every flagged anomaly needs validation and classification before it triggers action. Is the flagged point a genuine outlier, a data entry error, a sensor malfunction, or actually a valid but rare event? This triage process determines whether you correct data, escalate a security alert, or retrain your model. Without structured validation, your anomaly detection system generates noise rather than insight.
Reducing False Positives
False positives erode trust in any detection system. Analysts who are bombarded with false alarms start ignoring real alerts. To reduce false positives, implement anomaly scoring rather than binary classification. Assign each detected anomaly a severity score based on how far it deviates from expected patterns and how many independent detection methods agree on it. Ensemble approaches, where you combine results from two or three algorithms, dramatically improve precision without sacrificing recall.
Set up a feedback loop where analysts label flagged anomalies as true or false positives. Use this data to retrain and tune your models monthly.
Contextual validation is another powerful filter. Cross-reference detected anomalies against known events: system deployments, marketing campaigns, holidays, or weather events. A spike in web traffic that coincides with a product launch isn't anomalous; it's expected. Building an event calendar into your detection pipeline eliminates a large share of false positives automatically and frees analysts to focus on genuinely suspicious patterns.
Building a Response Workflow
Classify confirmed anomalies into actionable categories: data quality issues (fix the data), operational problems (alert the relevant team), security threats (escalate immediately), and model drift (retrain your models). Each category should have a defined owner, response time SLA, and resolution process. This structure transforms anomaly detection from a passive monitoring tool into an active component of your data governance and security operations.
Document every confirmed anomaly and its resolution. This historical record becomes training data for supervised models and a reference for future investigations. Over time, your detection system becomes smarter, your false positive rate drops, and your team builds institutional knowledge about what kinds of anomalies matter most in your specific domain. The goal is a self-improving cycle where each detected anomaly makes the system better at catching the next one.
Frequently Asked Questions
?How do I tune a Z-score threshold beyond the default 3 standard deviations?
?When should I use supervised vs. unsupervised anomaly detection?
?How long does it realistically take to profile data before running detection?
?Is it a mistake to rely on point anomaly methods for collective anomalies?
Final Thoughts
Identifying data anomalies effectively requires understanding what types exist, profiling your data thoroughly, selecting appropriate AI detection methods, and building a structured validation workflow. No single algorithm solves every problem, and domain knowledge remains irreplaceable even as AI tools grow more sophisticated.
Start with clear data profiling, match your detection approach to the anomaly types most relevant to your domain, and always close the loop with human validation. The organizations that get this right don't just find outliers; they turn those discoveries into measurable improvements in data quality, security, and operational performance.
Disclaimer: Portions of this content may have been generated using AI tools to enhance clarity and brevity. While reviewed by a human, independent verification is encouraged.